Ligand Perturbation
This notebook walks through simulating the overexpression of the IL21 ligand and studying the shift in cell profile across T cells in human tonsils
%load_ext autoreload
%autoreload 2
%config InlineBackend.figure_format = 'retina'
import pandas as pd
import scanpy as sc
import sys
import numpy as np
import seaborn as sns
import matplotlib.pyplot as plt
from scipy.stats import mannwhitneyu

sys.path.append('/Users/koush/Projects/jishnulab/SpaceTravLR/src')
from SpaceTravLR.virtual_tissue import VirtualTissue
adata = sc.read_h5ad('/Volumes/SSD/training_data/snrna_human_tonsil.h5ad')
adata
AnnData object with n_obs × n_vars = 5778 × 3333
    obs: 'cell_type', 'author_cell_type', 'cell_type_int', 'banksy_celltypes', 'cell_type_2'
    uns: 'cell_thresholds', 'cell_type_int_colors', 'received_ligands', 'received_ligands_tfl'
    obsm: 'X_umap', 'spatial', 'spatial_unscaled'
    layers: 'imputed_count', 'normalized_count'
Define color palette
color_dict = {
    'Naive CD4 T': '#f721b7',
    'Treg': '#ecc91d',
    'T memory': '#3a9c2b',
    'Th1': '#c43cf2',
    'Th2': '#5e6ff3',
    'T_CD8': '#dd3652',
    'T_follicular_helper': '#e28723',
}
Setup a VirtualTissue for loading and visualizing perturbations
tonsil = VirtualTissue(
    adata = adata,
    annot = 'cell_type_2',
    color_dict=color_dict
)
tonsil.init_cartography(adata,
    restrict_to=[
        'Naive CD4 T',
        'T_follicular_helper',
        'Th2',
        'Th1',
        'Treg',
        # 'T_CD8',
        'T memory'
    ]
)


plot_params = {
    'perturb_target': '',
    'hue': 'cell_type_2',
    'curve': True,
    'grid_scale': 2,
    'alpha': 0.6,
    'grains': 25,
    'figsize': (5, 5),
    'dpi': 200,
    'legend_fontsize': 7,
    'dynamic_alpha': False,
    'scatter_size': 25,
    'rename': {
        'T_follicular_helper': 'Tfh',
        'T_CD8': 'CD8 T',
        'T_CD4': 'non-Tfh CD4 T',
        'B_germinal_center': 'B Germinal Center',
        'B_naive': 'B Naive',
        'B_memory': 'B Memory',
        'Naive CD4 T': 'Th0',
    },
    'limit_clusters': True,
    'highlight_clusters': [
        'T_follicular_helper',
        'Th1',
        'Th2',
        'Naive CD4 T',
        'Treg',
        'T memory'

    ]
}
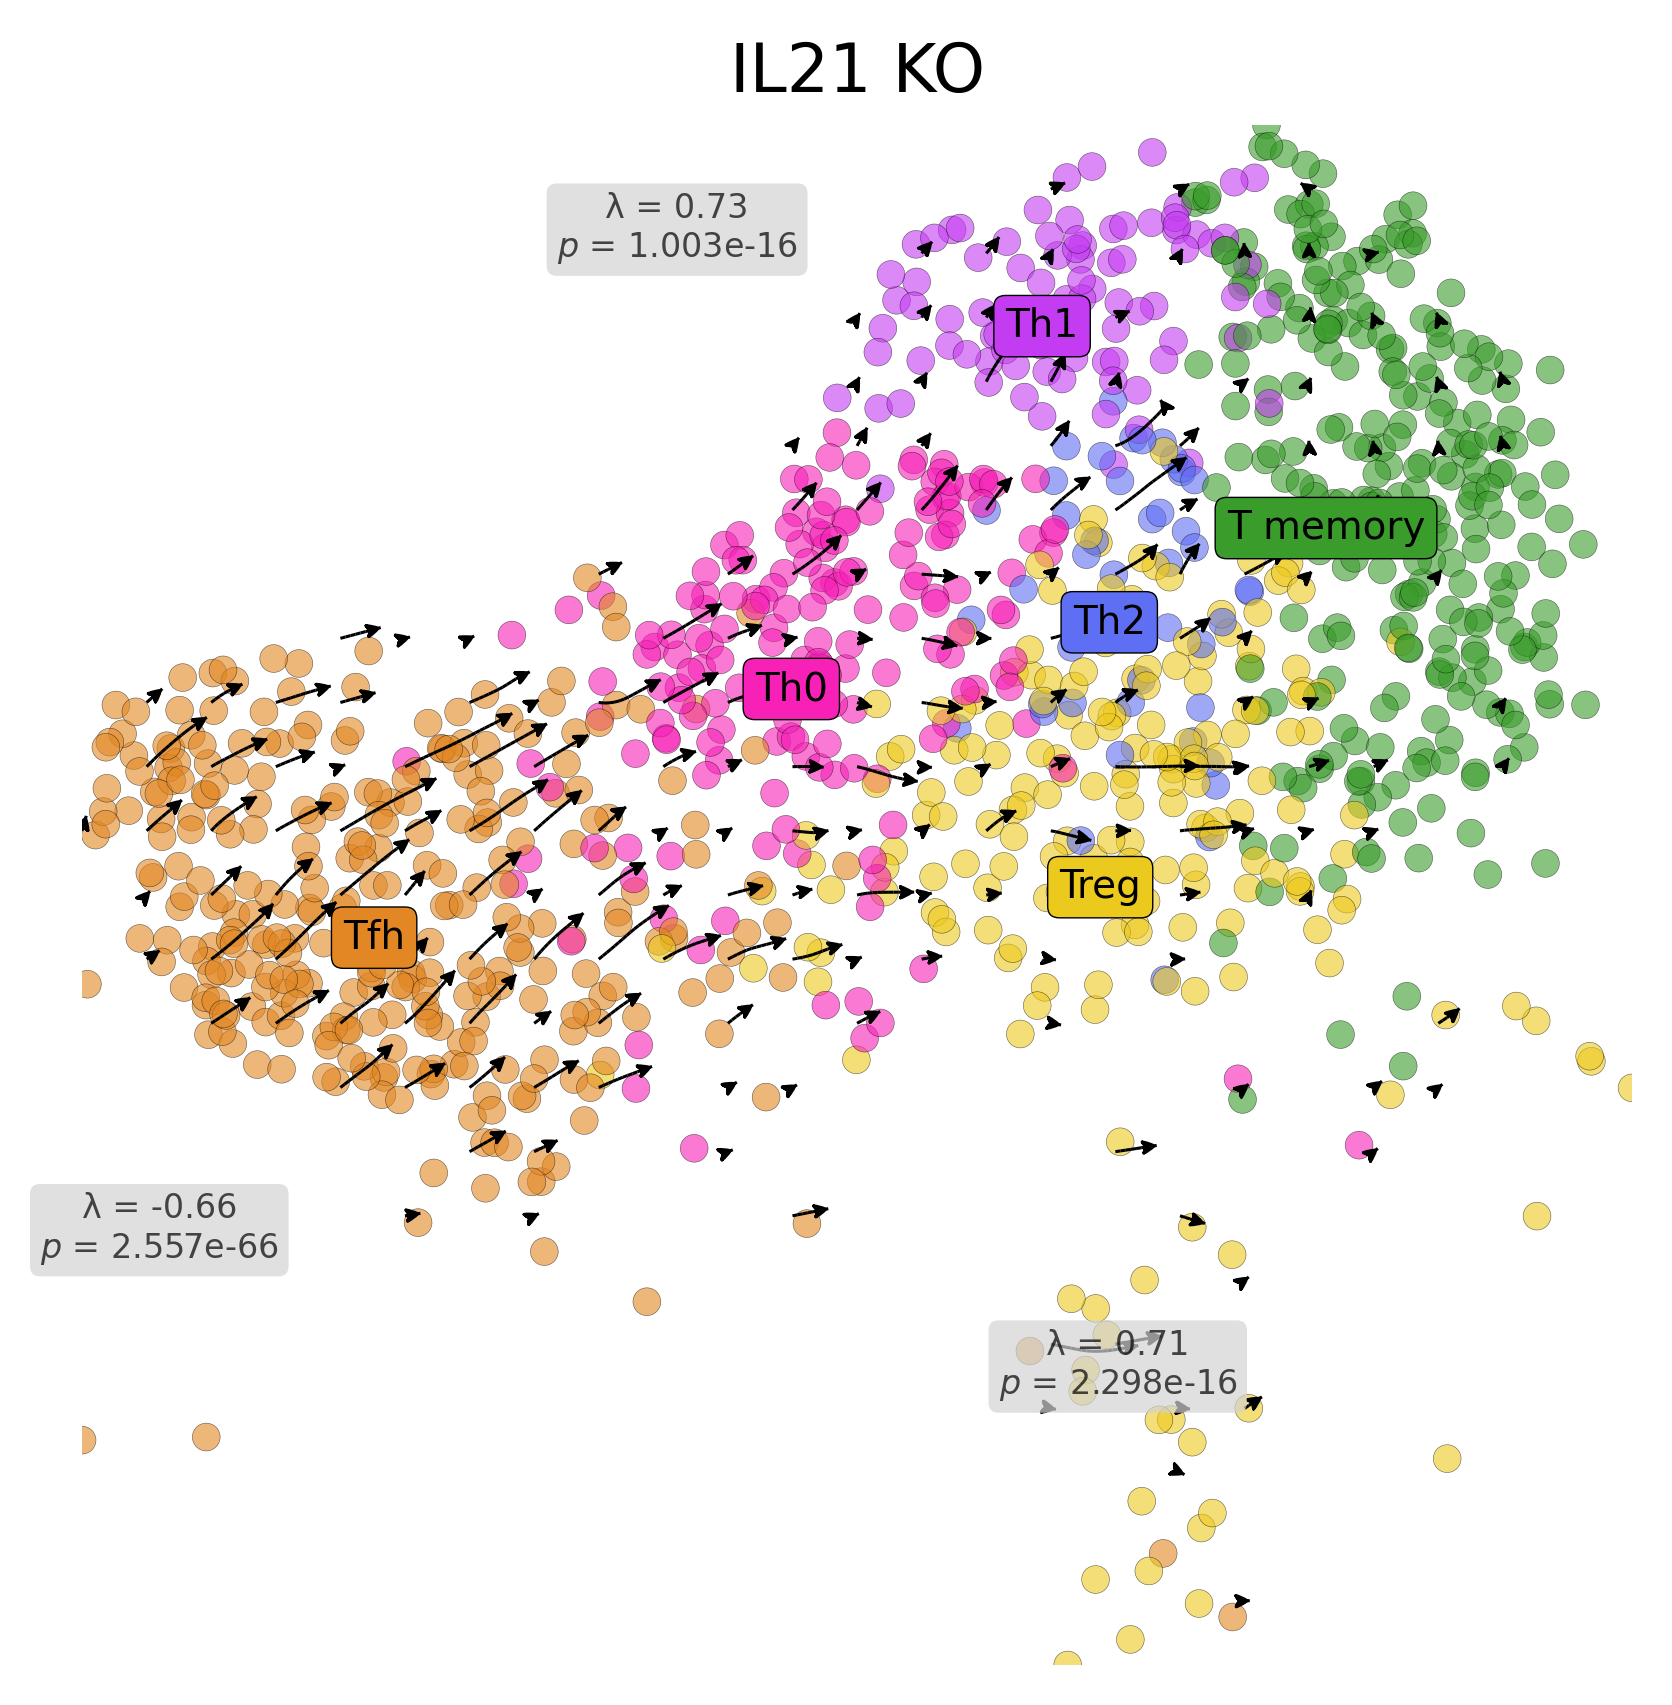
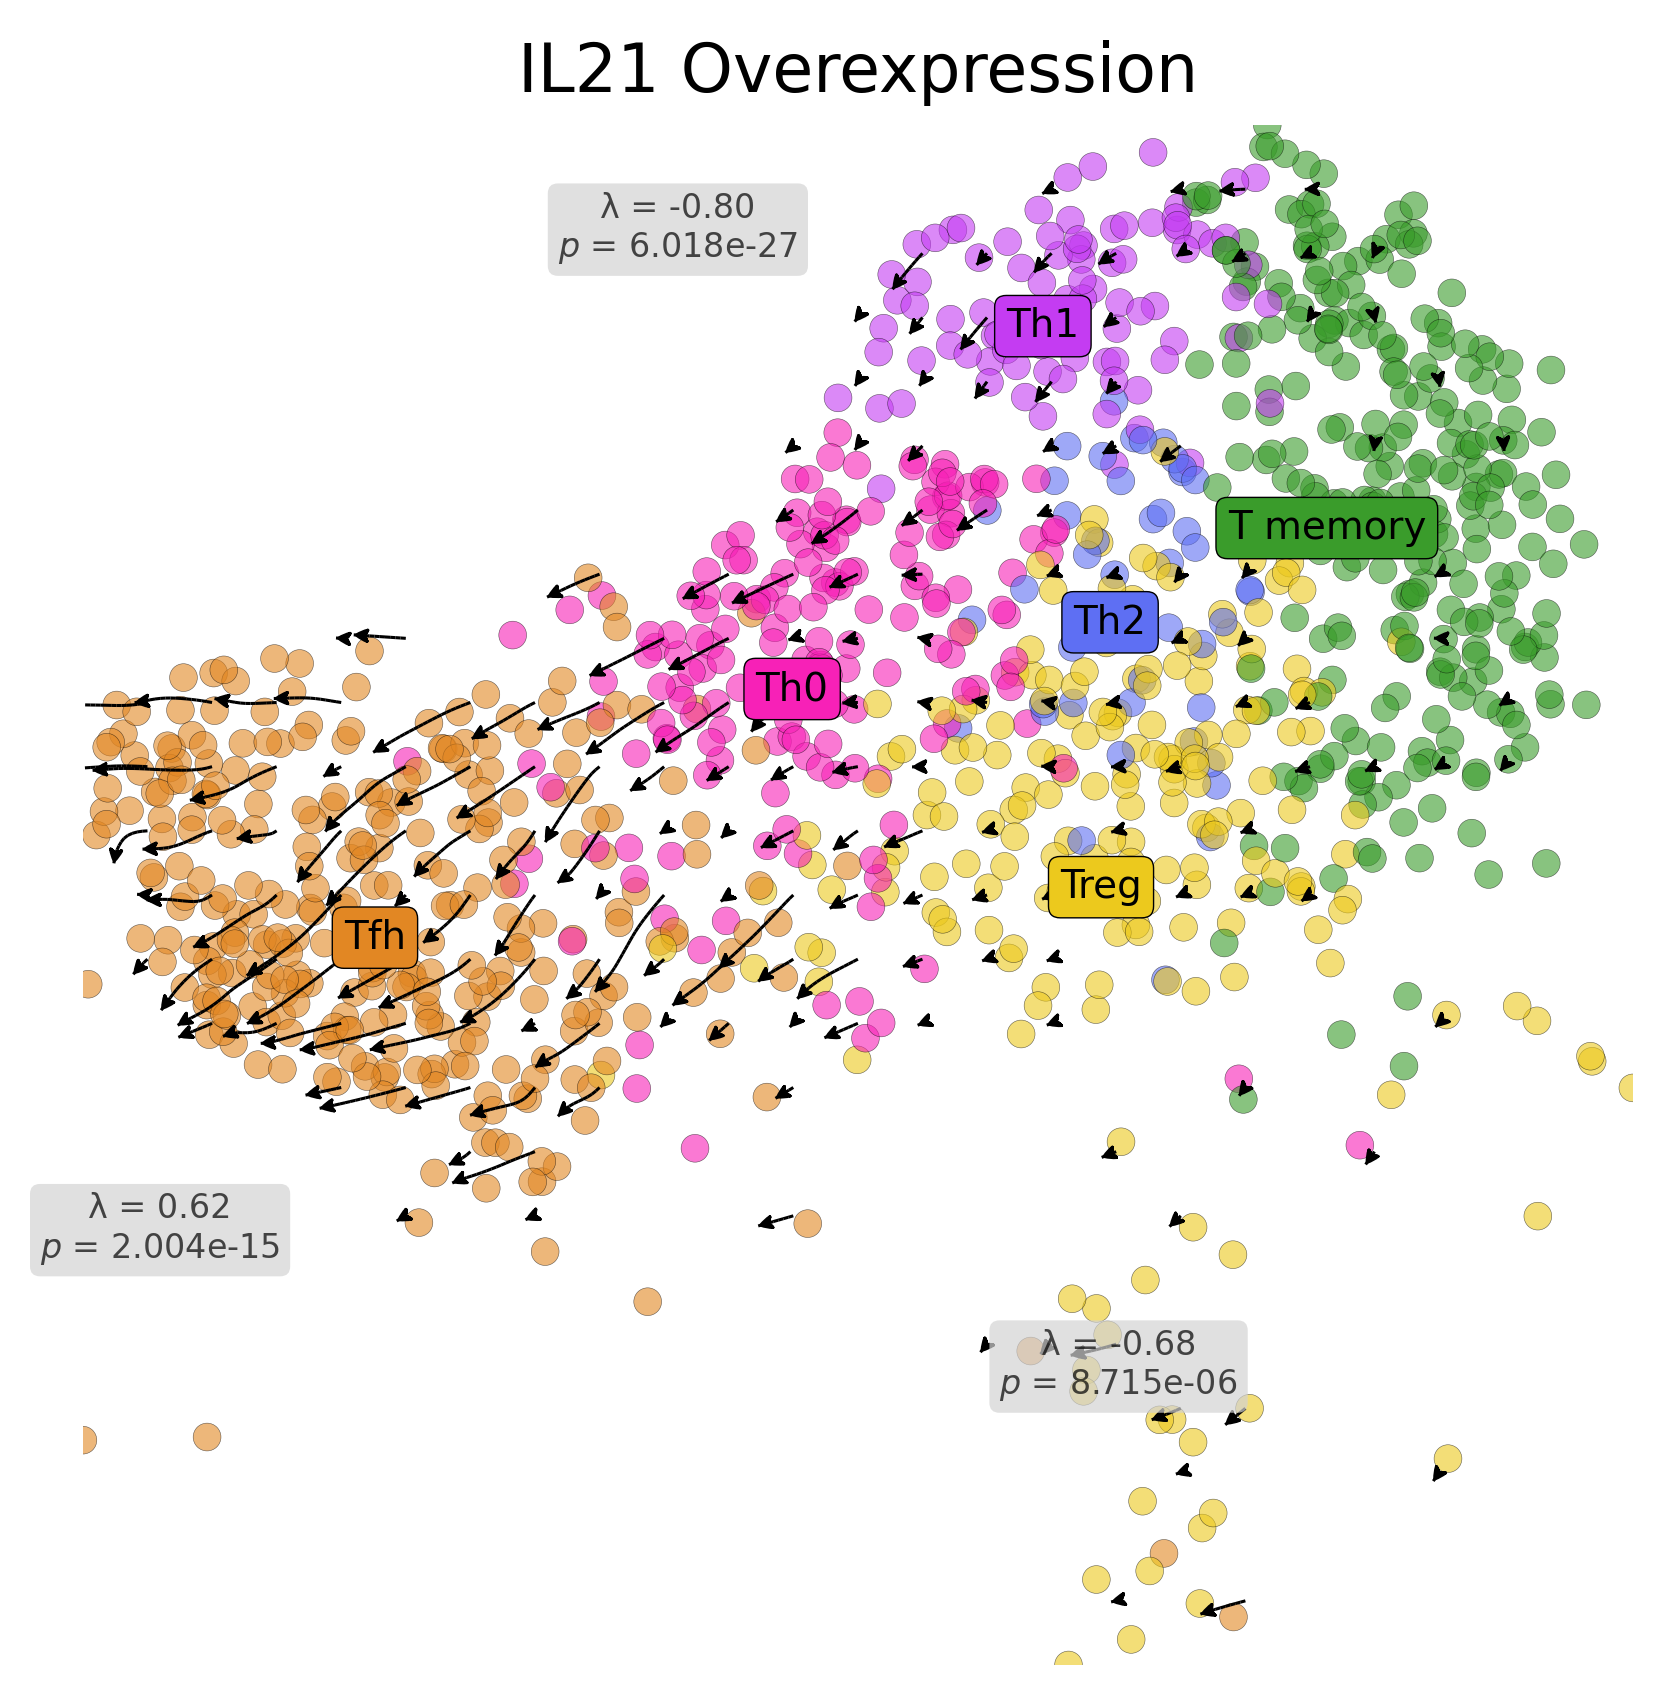
The simulation results are visualized as a vector map on the UMAP space, representing a potential shift in cell transcriptomic identity in response to IL21 perturbation.
pairs = [('Naive CD4 T', 'T_follicular_helper'), ('Naive CD4 T', 'Th1'), ('Naive CD4 T', 'Th2')]
annot = 'cell_type_2'
source_cell_type = 'Naive CD4 T'
tonsil.compute_branched_pseudotime(pairs, annot, source_cell_type)
plt.rcParams['figure.figsize'] = (6, 6)
plt.rcParams['figure.dpi'] = 200
plt.rcParams['figure.facecolor'] = 'none'
plt.rcParams['axes.facecolor'] = 'none'

perturbed_df = pd.read_parquet(
    '/Volumes/SSD/genome_screens/human_tonsil/IL21_4n_maxx.parquet')

grid_points, vector_field = tonsil.plot_arrows(
    perturbed_df=perturbed_df,
    **plot_params
)


perturbed_df_rand = perturbed_df.copy()
perturbed_df_rand[:] = np.random.permutation(
    perturbed_df.values.flatten()).reshape(perturbed_df.shape)

_, vector_field_rand = tonsil.plot_arrows(
    perturbed_df=perturbed_df_rand,
    **plot_params
)
plt.close()

alignment_df, df, alignment_df_rand, df_rand = tonsil.compute_vector_alignment(
    grid_points, vector_field, vector_field_rand
)

for ct, xy in zip(['T_follicular_helper', 'Th1', 'Th2'], [(6.65, 10.25), (9, 14.65), (11, 9.65)]):
    x = df[df['cell_type'] == ct]['alignment']
    y = df_rand[df_rand['cell_type'] == ct]['alignment']
    stat, p = mannwhitneyu(x, y, alternative='two-sided')
    plt.text(
        xy[0], xy[1],
        f"λ = {df[df['cell_type'] == ct]['alignment'].mean():.2f}\n$\\it{{p}}$ = {p:.3e}",
        bbox=dict(boxstyle="round", fc="lightgrey", lw=0, alpha=0.7),
        fontsize=6, ha='center', va='center', alpha=0.7
    )

plt.title('IL21 Overexpression')
plt.show()
perturbed_df = pd.read_parquet(
    '/Volumes/SSD/genome_screens/human_tonsil/IL21_4n_0x.parquet')

grid_points, vector_field = tonsil.plot_arrows(
    perturbed_df=perturbed_df,
    **plot_params
)

perturbed_df_rand = perturbed_df.copy()
perturbed_df_rand[:] = np.random.permutation(
    perturbed_df.values.flatten()).reshape(perturbed_df.shape)

_, vector_field_rand = tonsil.plot_arrows(
    perturbed_df=perturbed_df_rand,
    **plot_params
)
plt.close()

alignment_df, df, alignment_df_rand, df_rand = tonsil.compute_vector_alignment(
    grid_points, vector_field, vector_field_rand
)

for ct, xy in zip(['T_follicular_helper', 'Th1', 'Th2'], [(6.65, 10.25), (9, 14.65), (11, 9.65)]):
    x = df[df['cell_type'] == ct]['alignment']
    y = df_rand[df_rand['cell_type'] == ct]['alignment']
    stat, p = mannwhitneyu(x, y, alternative='two-sided')
    plt.text(
        xy[0], xy[1],
        f"λ = {df[df['cell_type'] == ct]['alignment'].mean():.2f}\n$\\it{{p}}$ = {p:.3e}",
        bbox=dict(boxstyle="round", fc="lightgrey", lw=0, alpha=0.7),
        fontsize=6, ha='center', va='center', alpha=0.7
    )

plt.title('IL21 KO')
plt.show()